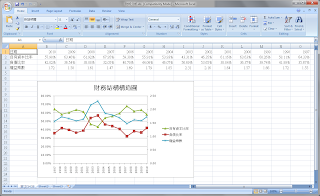
財務結構欄位說明
日期: 輸入 yyyy/mm/dd. Format Cells as Number > General > Type > yyyy (任選一個現有 Type,手動更改為 yyyy)
自有資本比率: 輸入 57.98%. Format Cells as Percentage > Decimal places:2
負債比率: 輸入 = 1 - 自有資本比率. Format Cells as Percentage > Decimal places:2
權益乘數: 輸入 1/自有資本比率. Format Cells as Number > Decimal places:2
財務結構構造圖說明
操作步驟:
- 插入表格: Insert > Line > 2-D Line > Line with Marker. 理論上應該是空白一片.
- 插入自有資本比率資料: Select Data... > Add in Legend Entries (Series) > 輸入「自有資本比率」到 Series Name > 點選 Series Values 欄位,用滑鼠拉出自有資本比率資料範圍 (B2~O2) > OK
- 插入負債比率、權益乘數資料: 類似步驟2.
- 調整 Horizontal (Category) Axis Labels 為日期: Edit in Horizontal (Category) Axis Labels > 用滑鼠拉出日期資料範圍 (B1~O1) > OK.
- 調整標題: 標題點兩下直接改. (如果不小心把標題刪掉,可依底下步驟新增標題: On the Chart Tools Layout tab, in the Labels group, click Chart Title icon > Select Above Chart.)
- 調整 Vertical Axis 為雙座標: 點權益乘數線段 > Format Data Series > Series Options > Plot Series On: Secondary Axis.
打完收工,謝謝大家收看。
沒有留言:
張貼留言